
Rock, Paper, Scissors and the Curious Case of Bertlemann’s Socks Part I
Whenever my kids have a dispute about who gets to sit in the front seat of the car, they turn to the ancient game of Rock, Paper, Scissors…

Whenever my kids have a dispute about who gets to sit in the front seat of the car, they turn to the ancient game of Rock, Paper, Scissors.
First mentioned in written records around 1600 AD, the game originated in China probably over 2000 years ago. It spread from China through Japan and to the rest of the world by the 20th century. It has had a few different names including the amusing Chief-Tiger-Chief’s Mother version, Snake-Frog-Slug, and, from my native Canada, Bear-Man-Gun. Legend has it that George Washington, Lord Cornwallis, and General Rochambeau played it to decide who should be the first to leave the tent after the signing of the British surrender at Yorktown in 1781. Rochambeau won. Since then the game has sometimes been called Ro-Sham-Bo.
Mathematically, Rock-Paper-Scissors is what is called a “zero sum” game since there is no shared benefit to any outcome. I win, you lose. You win, I lose. One of the reasons why it is so often used to resolve disputes is that there is no winning strategy and no way to cheat. (Albeit, scissors is statistically chosen slightly less frequently than paper or rock.)
Another popular way to resolve disputes is the coin flip. The coin flip is similar to rock paper scissors but there is a missing element of control since the result is not determined by the combined choices of the two opponents but by an element of randomness in the coin. In a coin flip, one person usually has to “call it” heads or tails but calling it is no advantage since coins are equally likely to fall on one or the other side. In coin flipping, it is also possible to cheat by using an unfair coin.
Both Rock-Paper-Scissors and coin flips are examples of randomness, meaning that in both cases who will win or lose is uncertain. We measure uncertainty with a number from 0 to 1 called a probability. Mathematically, a probability is the ratio of the number of events that meet some criteria like “heads” to the number of all possible events in a given scenario like a coin flip. So in this case, a coin has two possible outcomes, heads and tails. Those outcomes are mutually exclusive, meaning they can’t both occur at the same time, and each event is equally “likely” so that means that the ratio of the number of outcomes that turn up heads to the total possible outcomes which is heads or tails, is 1/2. That is where the probability 1/2 or 50% comes from for the coin being heads.
The probability that what you called matches what side of the coin is facing up is also 50%. I am going to come back to that idea of what we see and what an event is being the same in a moment because probability gets a lot weirder when we introduce quantum mechanics into the picture. In particular, we find that in a quantum universe, probability does not work the same way as in the mundane world of rock-paper-scissors.
Despite their ancient origins, mathematicians and philosophers haven’t yet decided what it actually means for an event like a coin flip to have a probability. Two schools of thought have argued contrary viewpoints. The Frequentist school says that a probability is when you flip a coin many times in a row and you count how many times it comes up heads and how many times tails. The ratio of heads to total flips as the number of flips approaches infinity is the probability. The Bayesian school says that the probability is a measure of the “belief” of the person observing it combined with the logical underpinnings of that belief. Given how much knowledge I have about the coin, I can express my belief, as a rational person, as being 50% heads and 50% tails. I don’t need to flip the coin many, many times to express that probability. I don’t even need to flip it once.


Imagine now that you are a scientist who is trying to predict where an oncoming hurricane will land and how much damage it will do. Will you take a frequentist philosophy or a Bayesian?
When predicting how unique events will unfold, you have to take a Bayesian approach. Hurricanes, climate change, and pandemics like COVID-19 are all non-repeatable events. No two hurricanes and no two pandemics are exactly the same. When the Institute for Health Metrics and Evaluation (IHME) in Washington State builds its predictions for how many people will die in each state over the course of future months, it is not based on repeated experiment, but on a logical construct such as a random graph in our last article. Your models are not measurements of repeated examples of the same hurricane but logical constructs of how hurricanes behave and the measure of uncertainty that goes along with that. When a model’s assumptions are wrong, the model predicts an incorrect outcome and needs to be adjusted.
In the Bayesian philosophy, a model being wrong is okay as long as you account for that uncertainty in the model itself. Error bars, a measure of the uncertainty in a prediction, can help to control your enthusiasm for a model’s prediction. Every model has them and yet when the news media reports on a model, they never look at the error bars. Error bars often tell you a lot more about what is going to happen than the middle line, which is just the point of highest probability.
Sometimes models are so bad that they completely fail to contain reality. These are just bad models. Take a look at a model that was recently reported in the news media here:
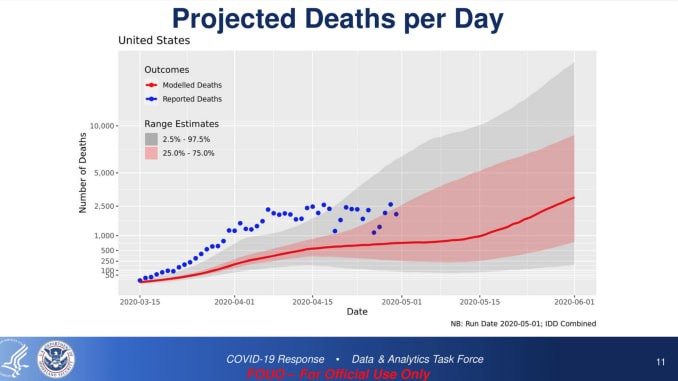
The headline on CNBC was “Coronavirus deaths projected to hit 3,000 per day by June, internal Trump administration analysis says”. The slide appears to be comparing measured deaths per day with a model that was created in mid-March. The model clearly hasn’t been updated since then since none of the measured deaths, the blue dots, after that date agree with the model’s mean, the red line. The prediction CNBC and a number of other news outlets are reporting on is the red line.
While it is an “internal Trump administration analysis” it is an incredibly bad one. Take a look at the error bars. Here there are two sets of them. The red shading represents a 25% to 75% certainty, accounting for 50% of the total probability. That means that a measurement is equally likely to fall inside the red shading as outside. The gray shading represents 2.5% to 97.5% meaning that a measurement has a 95% probability of landing inside the gray or red shaded areas. How wide the shading is is not that important to how good a model is. It is simply a measure of the uncertainty based on the Bayesian belief philosophy. Shading that is too wide is called “pessimistic”. Shading that is too narrow is called “optimistic”. Ideally, shading should be neither too narrow nor too wide. The model here is bad because the measured values started to exit the 95% certainty area right after the initial day. Rather than rising slowly like the model predicted, the number of deaths skyrocketed and then leveled off after social distancing and lockdowns took effect. If the uncertainty had taken that into account, that would be fine, but here it seems the model was far too optimistic.
When developing a vaccine or drug to fight the virus, scientists take a Frequentist approach. A Bayesian would be fine with a mathematical or computer model to tell us how effective a drug would be. Yet, such thinking is dangerous, we should never assume anything about how a drug or vaccine will affect people. Instead, we have to conduct studies, replicating the same experiment over and over again with many, many people and studying the probability that the drug or vaccine will be effective across a diverse population.
Frequentist philosophy suffer its own drawbacks however in that it often leaves out the logic that a Bayesian would apply to determine if an outcome is as likely as it appears to be. The prescription of hydrocloroquine for COVID-19 patients is an example. A study showed some benefit despite no logical reason why it should work at all since hydrocloroquine is a malaria drug and malaria is not a virus. It was reported on the news. The President touted it in press conferences. There was some push among desperate doctors trying to save the sickest patients and ultimately it turned out, according to this latest study published in The Lancet, to cause more harm than good.
Part of the problem with Frequentists is their reliance on the p-value of a study’s outcomes. A p-value is simply a measure of how likely a result is to be random. Generally, in medical studies, if a p-value is less than 0.05 or about 5 percent, then the result is considered to be real. (By contrast in experiments in High Energy Particle physics to prove the existence of a new particle, we expect p-values around a millionth, but no medical study could ever give such confidence.)
The over-reliance on p-value at the expense of logic has led to many studies with counter-intuitive results later being proved false. It has also led to bad scientific practices in the search for science glory like p-hacking, data dredging, snooping, fishing, and butchery. These involve taking loads of data and fishing for results. P-hacking has led to studies showing that Extra-Sensory Perception (ESP) is real but are impossible to replicate.
The Data and Statistics web magazine FiveThirtyEight.com shows how easy it is to p-hack. A nifty little web app lets you find correlations between political parties and the U.S. economy. Find your own publishable results now!
If you want to find real results you need to take both a Bayesian and a Frequentist approach. You need to question your logic and assumptions to avoid bad models like the DHS one. You also need to question your data. Just because “the data supports it” does not mean that it is real. Study after study has been published and broadcast through the news media over the years that has later been found to be false or completely the opposite of the truth. In fact, most research findings are false because most research studies are small and never replicated.
All models are wrong and most statistically significant results are also wrong, so why should we trust the recommendations of scientists? First, a model can be wrong but still be useful, and a model that captures uncertainty correctly can tell us how our actions affect the future better than no model at all. If that were not true, we would never have been able to land on the moon. It was a statistical model, the Kalman filter, that captured uncertainty in radar measurements and combined it with rocket motion models to allow mission control to track the Apollo spacecraft from hundreds of thousands of miles away. All radars work by the same principles now including air traffic control.
Likewise with replication and scrutiny, bad results from data can be eliminated. The case of hydrocloroquine is an example. Many studies were carried out simultaneously and eventually they determined that the initially promising results were noise in the data. Science is not always right but it is self-correcting. Sometimes the right prescription for action is more study (it almost always is), but in crisis the best models can help policy makers even when uncertainty is high.
In this article, I’ve only talked about classical uncertainty. Classical uncertainty means that we are trying to capture what we don’t know in a model or an analysis of data. We assume, however, that a real answer exists. If, for example, I flip a coin and hide it under my hand, you can be assured that it is heads or tails even before you have seen it. If we play rock-paper-scissors with our eyes closed, likewise, the result is there, hidden until we open them. Coronavirus, likewise, has a definite number of people it is going to kill in the coming days and weeks. If we had perfect knowledge, perhaps we could have a perfect model that would tell us down to the individual who might die (scary as that thought might be).
In quantum mechanics, I will talk about in Part II, this is not so. We will start off by talking about the curious case of Bertlemann’s socks.